Volume-Weighted Average Price (VWAP) is a technical indicator that measures the average price that stocks and other securities are bought and sold for during the trading day. It forms a trend line by taking volume into account when measuring this number.
I’m a champion of simple trading, but VWAP is one of the indicators I think every trader should know about.
Its importance has a simple reason — other traders watch it. If a stock is trading above VWAP, that means most day traders are making money. If it’s trading below VWAP, that means most day traders are in the red.
As a savvy trader, you’re always looking for that extra edge to enhance your trading strategies. VWAP provides an average price for a security that reflects both its value and how it’s being traded. It’s an insight into the market’s pulse, offering an average price that large buyers and sellers might aim for to maximize their positions while minimizing market impact.
Want to know more about this useful indicator? Read on for examples of how it impacts the markets and traders alike!
Table of Contents
What Is Volume-Weighted Average Price or VWAP?

Volume-Weighted Average Price, commonly known as VWAP, is a trading indicator that provides an average price for a particular security, adjusted according to the amount of shares traded. It’s a potent tool that offers traders, chartists, and investors a more comprehensive picture of a stock’s price action throughout the day.
It’s a type of moving average. Like other indicators of past price action, there’s some lag (but not a lot).
VWAP is just one acronym you need to know to become a fully self-sufficient trader. To further enhance your trading skills, it’s crucial to familiarize yourself with other trading terminologies.
Our comprehensive guide on Trading Terms You Need to Know provides a detailed explanation of the most commonly used terms in the trading world. This knowledge will help you navigate the trading landscape more effectively. Start expanding your trading vocabulary today.
What Does VWAP Indicate?
VWAP serves as a benchmark, providing valuable information about the trend of a stock. It charts a range of the stock’s overall average sale price during the day.
By looking at VWAP compared to the current asking price, you can see whether a stock is moving in a bullish (upwards) or bearish (downwards) direction.
Why Do Traders Use VWAP?
Traders like VWAP for several reasons. The indicator helps them make informed decisions by providing a single line on their charts that represents the average price.
The general idea with VWAP is that you can assess the current price of the stock in relation to this benchmark, which will help you determine entry and exit points. It can also help you determine whether you want to take an aggressive or more cautious approach toward the trade.
VWAP can help you make a more detailed and confident plan for your trade. It shouldn’t decide your trades, but it can help provide confirmation.
Here are some of the benefits it can offer:
- VWAP is a simple indicator to use as part of your research.
- It can help determine entry and exit points for your trade.
- It can also help you detect a shift in the momentum of the stock.
Here’s what my millionaire student Roland Wolf has to say about VWAP:
“Generally, I like buying stocks over VWAP. I don’t really like buying stocks under VWAP for the most part, unless it’s like a panic dip buy or something like that.”
Calculating VWAP

Calculating VWAP involves more than just finding the average. It uses both price and volume data, giving more weight to prices with higher trading volume.
Understanding VWAP is useless without a broader framework in technical analysis. Our article on Technical Analysis provides a deep dive into how you can use various indicators, including VWAP, to make informed trading decisions.
More Breaking News
- China SXT Pharma Launches AI Supply Chain Overhaul for TCMs
- Valterra Platinum Strengthens Position with Impressive Earnings Surge
- Credo Technology Unveils AI Retimer Amid Strategic Partnerships
- Credo Technology Unveils AI Innovation and Announces 3M Partnership
Components of the Calculation
VWAP’s formula is calculated using just price and volume. These are the two most important indicators, so that’s a pretty good start…
Steps to Calculate VWAP
Calculating VWAP involves a series of steps.
- First, multiply the price of each trade by its volume.
- Then, add these results together…
- Lastly, divide by the total volume of all trades.
The calculation is done for each price throughout the trading period — typically one day for intraday traders.
Use of Time Periods in the Calculation
Time plays a crucial role in the calculation of VWAP. Typically, traders use one trading day as the standard time frame, which makes VWAP particularly beneficial for day traders.
When the stock reaches its closing price, VWAP stops tracking. It resets the table for the next trading day.
Types of Traders Who Use VWAP
Different types of traders use VWAP for various purposes. Whether you’re a buyer or seller, institutional or retail trader, the VWAP indicator can bring significant value to your trading strategy.
Here’s a recent lesson that my millionaire student Mark Croock gave in my Trading Challenge on using VWAP:
https://t.co/VuLr2bfMW6 – Posted a New Video Lesson: #498-500: How To Utilize VWAP for Dip Buying An IDEAL setup $GSIT
— Mark Croock (@thehonestcroock) June 2, 2023
Intraday Traders
Many intraday traders use VWAP. By providing a benchmark for the day’s trading activity, it gives a quick snapshot of market sentiment.
Institutional Traders
Institutions use VWAP to help guide their trading strategies. They often try to buy below the VWAP and sell above it to achieve better-than-average prices.
Mutual Funds and Hedge Funds
Mutual and hedge funds use VWAP to lessen the market impact of their large orders. They’ll often buy below VWAP — or sell above the VWAP — pushing the price back toward the day’s average.
Retail Traders and Short-Term Traders
Retail and short-term traders use VWAP as an essential part of their analysis and decision-making process. It provides them with an indication of the trend, helping them to make more informed trading decisions.
Benefits of Using VWAP for Trading Stock Prices

VWAP has several benefits…
More Accurate Price Representation
VWAP, unlike simple moving averages, incorporates volume in its calculations, leading to a more accurate representation of a security’s price.
Reduced Market Impact on Trades
For institutional traders, using VWAP can help reduce the market impact of their large trades. By ensuring their trades are closer to the VWAP, they can limit the price slippage.
How to Trade With VWAP
VWAP offers several strategies for trading, from identifying potential support and resistance levels to setting entry and exit points.
You can take a long or a short approach on a stock using VWAP as part of your supporting research. Which approach you take is determined by various aspects like the stock price, the trend, whether there is a catalyst, and even the time of day.
A robust trading platform with real-time data and advanced charting capabilities is essential for trading with VWAP. Check out our list of the Best Trading Platforms for Day Traders to find a platform that best suits your trading style and needs.
Or just skip to the end and check out my favorite platform, StocksToTrade.
I use StocksToTrade to scan for news, tweets, earning reports, and more — all covered in its powerful news scanner. It has the trading indicators, dynamic charts, and stock screening capabilities that traders like me look for in a platform. I made sure that it did — I helped design it.
Grab your 14-day StocksToTrade trial today — it’s only $7!
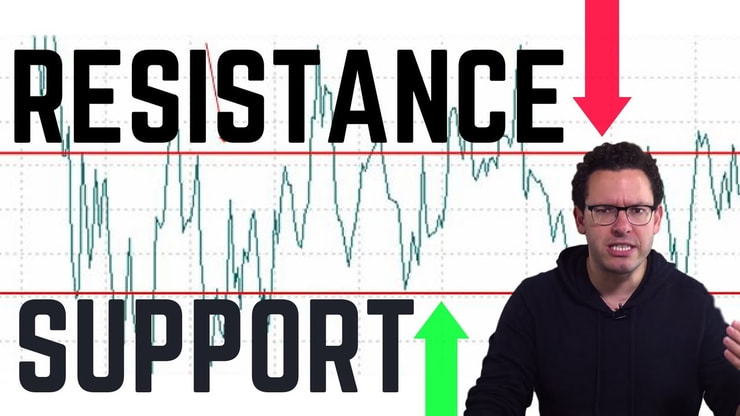
Support/Resistance
VWAP acts as a potential support or resistance level. If the price is above the VWAP, it could act as a level of support.
If the price is below VWAP, it can serve as resistance.
Entry and Exit Levels
Traders can use VWAP to help establish entry and exit points. For example, buying when the price is near or below VWAP and selling when the price is above VWAP can be a good strategy.
Gauge Relative Strength
By comparing a stock’s price to the VWAP, traders can gauge the relative strength or weakness of the stock.
Trade VWAP Price Crosses
Traders can look for opportunities when the price crosses VWAP.
When the price crosses above VWAP, it could be a bullish sign, while a cross below could indicate bearish sentiment.
If you want to read more about moving average crosses, check out my Moving Average Guide!
How Can You Interpret A VWAP Indicator?

Interpreting the VWAP indicator involves understanding its interaction with the stock’s price. A stock trading above its VWAP may suggest a bullish sentiment, while trading below may indicate bearish sentiment.
How to Use the VWAP Indicator
Using the VWAP indicator effectively requires an understanding of its characteristics and purpose.
Traders often use it in combination with other indicators like MACD or Bollinger Bands® to confirm signals and enhance their trading strategies.
Check out my article on MACD here — then learn how to use Bollinger Bands® to identify market trends here!
Key Takeaways
VWAP is an essential tool for traders, providing an average price weighted by volume. It helps in making informed trading decisions, improving entry and exit points, and managing market impact.
It isn’t a silver bullet for your trading plan — but VWAP is one of many topics you should learn as part of your trading education!
Trading isn’t rocket science. If you’re ready to work hard, you CAN become a self-sufficient trader. Trading has changed my life, and I think this way of life should be open to more people…
I’ve built my Trading Challenge to pass on the things I had to learn for myself. It’s the kind of community that I wish I had when I was starting out.
We don’t accept everyone. If you’re up for the challenge — I want to hear from you.
Apply to the Trading Challenge here.
Trading is a battlefield. The more knowledge you have, the better prepared you’ll be.
Do you use VWAP in your trading strategy? Let me know in the comments — I love hearing from my readers!


Leave a reply